What a 2% Conversion Rate Is Actually Costing You (With Calculator)

Going — the meditation app — doubled their premium trial signups with a single A/B test. They didn't redesign the page. They didn't rewrite the copy. They changed the CTA button text. 104% increase, month over month. (Unbounce, 2025)
That's the thing about conversion rates. The gap between where you are and where you should be isn't usually a design problem. It's a dozen small decisions — button text, form length, reading level, proof placement — each one invisible until you measure.
And most companies never measure.
If you're converting at 2%, you're not just "below average." At 10,000 monthly visitors and $100 deal value, you're handing $276,000/year to competitors. Same traffic. Same ad spend. This post shows you exactly how much you're losing — with real benchmarks, a free calculator, and 7 data-backed fixes.
What is a good landing page conversion rate by industry?
Unbounce analyzed 57 million conversions across 41,000+ landing pages for their 2024 Conversion Benchmark Report. It's the largest dataset of its kind. Here's where each industry lands.
4.3%
Median landing page conversion rate across all industries
Unbounce Conversion Benchmark Report, 2024
| Industry | Median | Average | Top 25% | Top 10% |
|---|---|---|---|---|
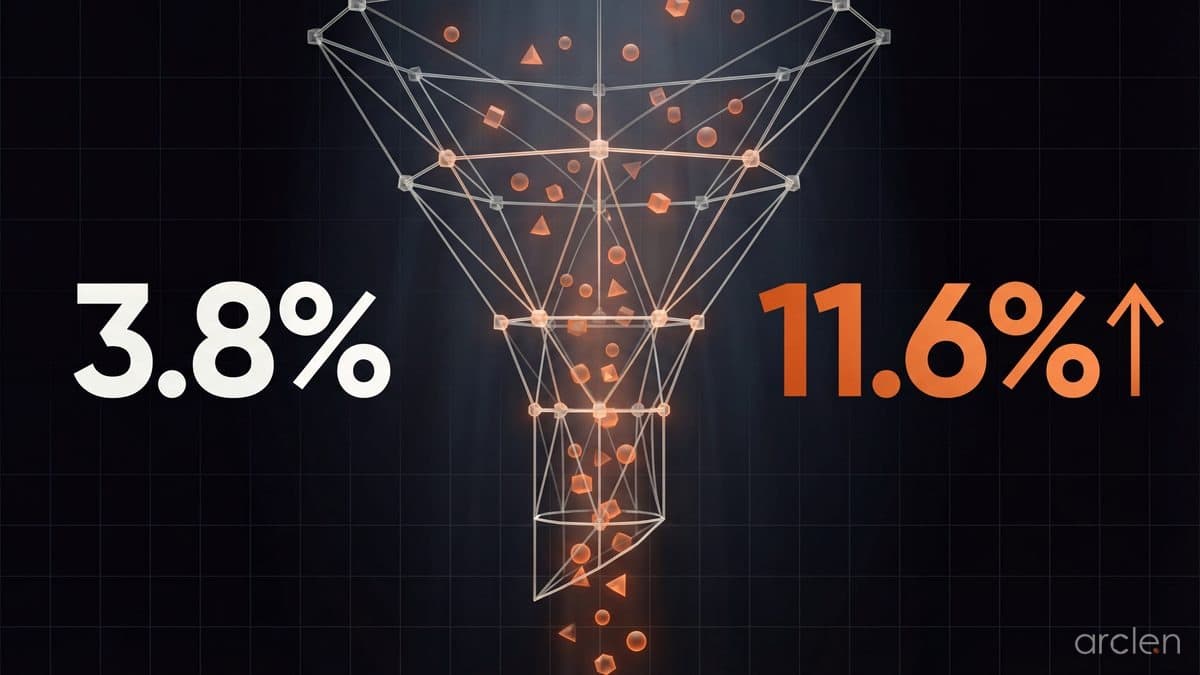
| B2B SaaS | 3.8% | 5.2% | 11.6% | 18.2% |
| eCommerce | 5.2% | 7.1% | 11.4% | 17.1% |
| Finance & Insurance | 6.2% | 8.5% | 13.1% | 19.5% |
| Healthcare | 5.0% | 6.9% | 10.8% | 16.2% |
| Education | 5.8% | 8.4% | 13.5% | 19.3% |
| Legal | 5.4% | 7.1% | 11.2% | 15.6% |
| Real Estate | 3.6% | 4.8% | 8.7% | 13.5% |
| Travel | 4.8% | 6.4% | 10.2% | 15.8% |
| Agencies | 3.3% | 4.6% | 8.2% | 12.6% |
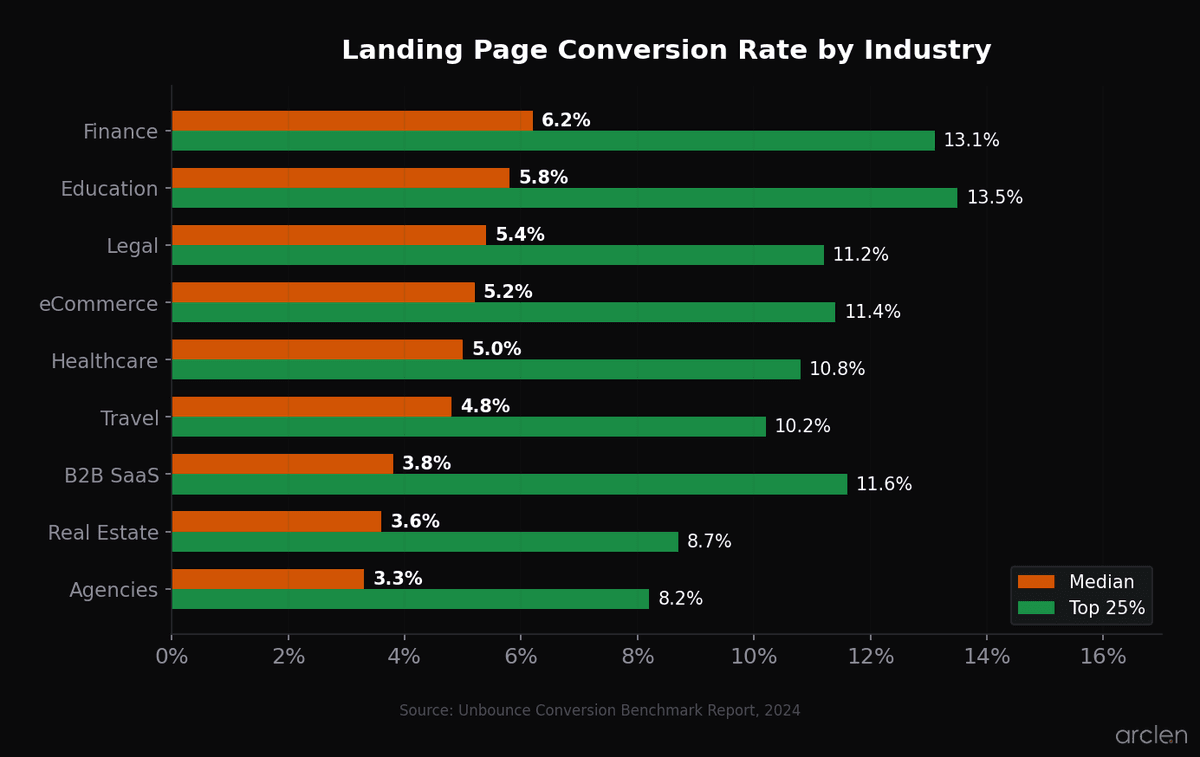
Three things stand out.
Finance and education lead. When someone searches "home insurance quote" or "MBA program near me," they're ready to act. The intent is hot. If you're in these verticals and converting below 6%, your page has a specific, identifiable problem.
SaaS and agencies sit at the bottom. More features to explain. More stakeholders. Longer decision cycles. This makes copy simplification critical. Unbounce's data shows pages written at a 5th-7th grade reading level convert at 11.1% — double the 5.3% rate of professional-level writing. And the correlation between complex language and low conversions is 62% stronger now than it was in 2020. (Unbounce, 2024)
The spread between median and top 10% is 3-4x. In every single industry. B2B SaaS: 3.8% median vs. 18.2% top 10%. The difference isn't talent or budget. It's process — systematic testing that compounds.
The mobile gap
Mobile drives 5x more traffic than desktop. But desktop converts 8% better across the board. In professional services, it's 40% better. (Unbounce, 2024)
And it's getting worse, not better. Average attention spans have dropped from 2.5 minutes in 2004 to 47 seconds in 2024. Your mobile visitors are faster, pickier, and less patient than ever.
A 1-second delay on mobile drops conversions by up to 20%. (Google/Ipsos) If your page takes 3+ seconds to load, 53% of mobile visitors are already gone. (Google, 2024)
Where do you fall?
- Below 2%: Something is broken. Unclear offer, dead form, or zero trust signals.
- 2-4%: Below average. High-impact fixes exist — this post covers them.
- 4-6%: Average. Competitive, but the calculator below will show what you're still leaving behind.
- 6-10%: Top quartile. Focus on systematic A/B testing.
- 10%+: Top 10%. You're outperforming most of your industry.
Context matters. A 2% rate with $50K enterprise deals may outperform a 10% rate on a $29/mo product. Use the calculator below to see your actual dollar gap — not just the percentage.
What a 2% conversion rate is actually costing you
Kareo, a medical software company, optimized their landing pages for doctor sign-ups. The changes added $1.56 million in annual revenue. (VWO case study) GetFPV, a drone parts retailer, generated 36,000 additional transactions and $3.4 million in new revenue from on-site conversion changes alone. (Unbounce, 2025)
Neither company hired a new agency or tripled their ad budget. They fixed what was already there.
Enter your numbers below. See the gap for yourself.
Your Industry
Select your industry so we can compare against real benchmarks.
The math behind the gap
10,000 visitors/month. 2% rate. $100 deal value.
You get 200 conversions. $20,000/month. $240,000/year.
At the median (4.3%), same traffic produces 430 conversions. $43,000/month. $516,000/year.
That's $276,000/year sitting on a page that converts below average. Not from more traffic. Not from more ad spend. From the same visitors you're already paying for.
CAC inflation
When your conversion rate drops, your customer acquisition cost rises in lockstep. At $5 CPC:
| Conversion Rate | CAC (at $5 CPC) | Relative Cost |
|---|---|---|
| 1% | $500 | 5x |
| 2% | $250 | 2.5x |
| 3% | $167 | 1.7x |
| 5% | $100 | 1x (baseline) |
| 8% | $63 | 0.63x |
| 10% | $50 | 0.5x |
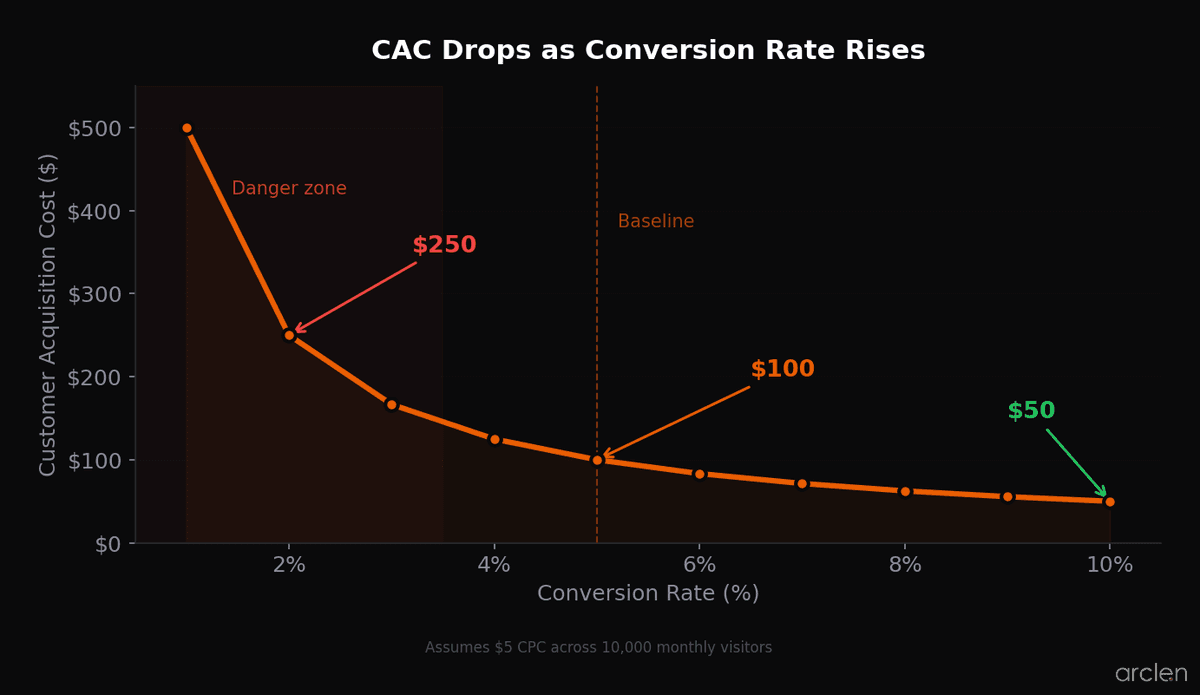
At 2%, you're paying $250 to acquire a customer who should cost $100. That's 2.5x more per customer than someone converting at 5%.
You can't outspend that. Your competitor with a better-converting page earns the same revenue at 60% less ad spend. Their unit economics fund growth. Yours fund waste.
7 fixes ranked by data
Not opinions. Not "best practices." These are the specific changes with the largest documented impact on landing page conversion rates.
1. Simplify your copy
Pages at a 5th-7th grade reading level convert at 11.1%. Professional-level copy? 5.3%. That's a 2x gap — and it's widening. The correlation between complex language and low conversions is 62% stronger now than in 2020. (Unbounce, 2024)
Average attention spans have dropped to 47 seconds. Your visitors aren't reading — they're scanning. Every jargon-heavy sentence is a small exit door.
Run your page through Hemingway Editor. Grade 8 or above? Rewrite it. We built a 17-point audit checklist for exactly this.
2. Cut your form to 3-4 fields
HubSpot analyzed 40,000+ forms and found that 5 or fewer fields convert 120% better than longer forms. Reducing from 11 to 4 fields? 160% increase. (HubSpot, 2023)
IMB Bank redesigned their loan application form and saw an 87% increase in completions. (VWO case study) The fix wasn't changing the questions — it was cutting the ones that didn't need to happen at first contact. Name. Email. One qualifier. Profile later.
3. Move social proof near your CTA
Testimonials buried at the bottom of your page are doing nothing. Move them within scroll distance of your CTA. Unbounce's data shows this lifts conversions up to 270%. (Unbounce, 2024)
Think about when doubt spikes: your visitor's finger is hovering over the button. A testimonial right there — from someone like them — dissolves it.
4. Fix page speed
Every second of mobile load time costs up to 20% of your conversions. (Google/Ipsos) If your PageSpeed Insights mobile score is below 80, this is your first priority — before copy, before design, before anything.
53% of mobile visitors leave if a page takes over 3 seconds. (Google, 2024) You're paying for traffic that never even sees your offer.
5. Personalize your CTA
"Start my free trial" converts 202% better than "Submit." (HubSpot, 2023) Going doubled their premium trials just by changing their button text. (Unbounce, 2025)
The principle: your button is a door. Label it with what's on the other side. First person. Specific outcome. "Get my report" not "Download." "See my results" not "Submit form."
6. Optimize for mobile first
Mobile drives 5x more traffic than desktop but converts worse across every industry. In professional services, desktop converts 40% better. (Unbounce, 2024)
Test on an actual phone. Not a responsive preview — an actual phone on a mediocre connection. If your CTA isn't visible without scrolling, you're losing the majority of your visitors.
7. Test your headline
The data shows most companies make at least 3 of the 14 most common headline mistakes. Your headline gets 2 seconds. If it's vague, clever-not-clear, or jargon-heavy, nothing else on the page matters.
A/B test 3-5 variants. The compounding effect is real — three quarterly wins of 15% don't add to 45%. They multiply: 1.15 x 1.15 x 1.15 = 1.52x. That's 52% total gain in 9 months.
Related reading
- Your Headlines Are Losing You Money. Here's the Data. — 14 headline mistakes costing you clicks, backed by 100M+ articles
- Landing Page Copy Audit Checklist: 17 Elements to Check — the point-by-point audit referenced throughout this post
- CRO for SaaS: The Complete 2026 Playbook — full playbook with benchmarks, frameworks, and tactical fixes
FAQ
The median across all industries is 4.3%. Top 25% starts at 8-12%. Top 10% is 12-19%, depending on industry. But "good" depends on deal value — a 2% rate closing $50K contracts can outperform a 10% rate on $29/mo products. Use the calculator above to see your actual dollar gap.
Divide total conversions by total visitors, multiply by 100. 200 conversions from 10,000 visitors = 2%. Most analytics platforms do this automatically. The harder question: which conversion event counts? For landing pages, it's usually form submissions or purchases — not page views or scroll depth.
For most industries, yes. The median is 4.3%, so 2% puts you below average. You'd need 2.15x more traffic to match a median page — that's 2.15x the ad spend for the same revenue. Exception: high-ticket B2B where fewer conversions at higher deal values still produce strong returns.
Copy readability has the largest documented impact. Pages at a 5th-7th grade level convert at 11.1% vs. 5.3% for professional-level copy — a 2x gap that's widening. (Unbounce, 2024) Other high-impact factors: form length (120% lift from fewer fields), social proof near CTAs (up to 270% lift), and page speed (20% drop per second of mobile delay).
Mobile drives 5x more traffic but desktop converts 8% better across all industries. In professional services, it's 40% better. The causes: smaller screens, harder form completion, slower loads, shorter attention spans. 53% of mobile visitors leave after 3 seconds. Most companies don't test landing pages on actual phones.
Individual fixes show results in days. A systematic testing program compounds 15-20% per quarter. Three quarterly wins of 15% multiply — 1.15 x 1.15 x 1.15 = 1.52x. That's 52% total gain in 9 months. Companies that invest in CRO see an estimated 223% ROI on average.
Written by Cam Rickerby
Founder at Arclen. Builds AI-powered conversion tools for marketers and agencies. Former growth lead. Obsessed with the gap between what data says works and what most landing pages actually do.
Get insights like this in your inbox
Data-backed marketing insights. No spam. Unsubscribe anytime.
Related posts
Why Your Ads Convert But Your Landing Page Doesn't
98% of paid ads have poor message match. Here's why your clicks don't become customers — and the 5 fixes backed by data from 464M visits.
Landing Page Copy Audit Checklist: 17 Elements to Check Before You Spend Another Dollar on Ads
A 17-point landing page copy audit checklist backed by data from 57M conversions. Fix the words on your page before you waste another dollar on ads.
Conversion Rate Optimization for SaaS: The Complete 2026 Playbook
The median SaaS landing page converts at 3.8%. Top performers hit 11.6%+. Here's the data-backed CRO playbook to close that gap in 2026.